Predicting Recurring Transaction Success

A few months ago, we laid out Recurly’s approach to optimizing subscription billing using machine learning. Today, we have a follow-up with more details about our approach, answers to common questions, and discussion about the improvements we’re gaining for our customers.
When we set out to improve our invoice retry process, we had a lot of questions. Would we be able to predict transaction success? What factors could impact the likelihood of a transaction succeeding? If we find many factors have an impact, how would we weigh all factors accurately?
Benefits of a Dynamic Model
Unlike other payments companies, Recurly’s product is centered on subscriptions. Our focus is on helping a wide variety of businesses grow and maintain their subscriber base. Our database contains payment transactions from thousands of subscription businesses dating back to our founding in 2009.
When we set out to research the optimal retry schedule to solve this complex problem, we considered building a static retry model. For instance, retry on Thursday, unless the customer is using a debit card, in which case retry on Friday. But as we studied our data and realized that many variables have an impact on retry success, our static model grew more and more complicated. We realized that a dynamic model that synthesized all of our research could be more successful.
And we proved it—we ran the models head to head. Dynamic models deliver stronger results than static models. As a result, we built a new experimental infrastructure where we can directly compare different retry models across a wide range of accounts. This infrastructure allows us to learn and iterate over time, delivering better results for our customers.
How does a dynamic model work? Let’s take an invoice with a 20-day retry window, and assume we only want to make two retry attempts. We’ll pick the two days within the 20-day window with the highest probability of success. To do this, we’ll model every potential transaction we could schedule in the 20-day window, comparing them to our database of transactions, and pick the two future transactions most likely to succeed.
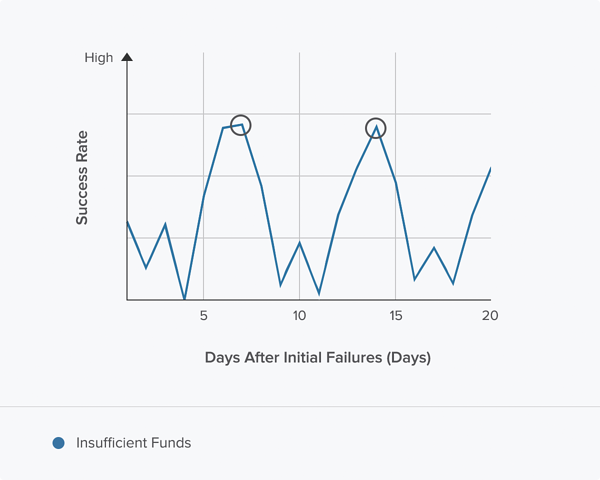
In this example, the subscriber is using a Visa debit card issued by a United States bank and the initial transaction failed with an “insufficient funds” error.
Based on the modeled probabilities, we would choose to retry on days 7 and 14:
What if the customer had a card issued by a Canadian bank, instead of a bank in the United States? In this case, the model suggests we pick days 6 and 20:

But what if this was a “temporary hold” failure instead? The model recommends we pick days 11 and 18:

As you can see, the days when a transaction is most likely to succeed are very different for each variable. Not only does each variable impact the overall retry success probability, but they have an interdependent relationship. For example, combining "insufficient funds" with a Canadian card will yield different high-likelihood days than combining "insufficient funds" with an American card.
This example has only a handful of variables, but you can start to see the complexity. Adding more variables gets you more potential interactions. You can quickly get to hundreds of combinations of variables for which you would have to devise custom logic.
We could devise a static logic that takes all of them into account, but it would be really complicated, error prone, and hard to maintain. Also, a hard-coded static retry logic could grow stale as consumer consumer behavior and business needs evolve. Instead, a dynamic logic that always produces the optimal retry time is the best approach. We are continually refining and testing versions of Recurly’s dynamic retry logic using new data as inputs to a Random Forest model (see our previous blog post for more background). The Random Forest model accounts for dynamic interactions between the features, allowing us to consider the impact of all variables together.
Actual Results vs. Predictions
Ultimately, all of these likelihoods are forward-looking predictions. Were our predictions accurate? Did the transactions we schedule succeed as often as our model predicted they would?
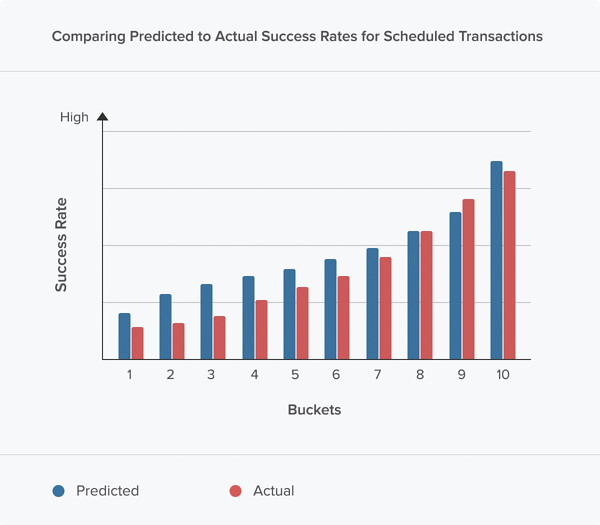
Transaction success did prove to be predictable, as the chart below shows. We’re comparing the predicted probability returned by one of our models for a transaction—before it was scheduled—to the actual probability of that transaction succeeding.
To make this chart, first we rank all of our transactions by the estimated probability of success (the prediction). Then, we divide these transactions into 10 equal buckets. The first bucket contains transactions that are least likely to succeed, the second bucket slightly more likely to succeed, and so on.
Finally, we can compare these predicted probabilities, before we scheduled them, to the actual success rates of the transactions, after they’ve occurred. The bucket of transactions that we predicted should contain 8% successes should actually contain close to 8% successes. Importantly, because the whole point of this model is to rank possible retry transactions by likelihood of success, we should see that the first “Actual” bucket succeeds less often than the second “Actual” bucket, indicating that we are rank-ordering potential transactions accurately.
Another way to think about this: our retry technology says, "Schedule this transaction next Tuesday at 3:15 p.m., because we think that transaction has a 26% chance to succeed and that’s higher than any other transaction in our window." Then, we look at that scheduled transaction after it happened—did it succeed or fail? We put that Tuesday at 3:15 p.m. transaction in a bucket with other transactions that we expected to succeed 26% of the time, and check to see if they actually succeeded 26% of the time.
The models have proven to be in line with our expectations, and we are excited to continue to train them with new data to further optimize their effectiveness for our customers.
Recurly’s new Revenue Optimization Engine uses these models and the outcomes of this research to deliver higher rates of transaction success. It's available in our Enterprise and Professional plans and one of our friendly colleagues in Sales would be happy to share more information with you.


